







REPORT on tribotechnical tests
Tests Objective
Detecting anti-frictional and anti-wear properties of NNN lubricating-and-cooling liquid (lubricoolant) in the form of 5% solution.
- Sample No.1 – Lubricoolant No.1
- Sample No.2 – Lubricoolant No.2
- Sample No.3 – Lubricoolant No.3
- Sample No.4 – Lubricoolant No.4
- Sample No.5 – Lubricoolant No.5
- Sample No.6 – Lubricoolant No.6
- Sample No.7 – Lubricoolant No.7
- Sample No.8 – without any lubricoolant
Stages of Works
- Detecting anti-wear properties according to the Reichert Method
- Detecting anti-friction properties according to ASTM G99 Standard
1. Detecting anti-wear properties according to the Reichert Method
1.1. Methodology and Equipment Description
The tests are held according to the Reichert Method (see Fig.1) that is traditionally used to detect anti-wear properties of the constructive and lubricating materials. The friction scheme during these tests is presented on Fig.2. The steel roller 1 rotating at frequency n=320 rpm is being pressed to the steel roller 2 by using the lever 3 with the standard force F.
Friction pair configuration: a sample in a form of Ø40 mm diameter roller – a counter body in a form of Ø14 mm diameter and 14 mm length roller, their axes are perpendicular
Friction pair materials: ШХ15 steel – ШХ15 steel
Lubricating materials: 5% solution lubricoolant / no lubricating material
Lubricating method: by dipping
Lubricating material volume in the container: 17 ML
Slide velocity: V=0.67 m/s
Load: F=121.4 N
Based on the tests results, linear wear value h on the motionless roller 2 (see Fig. 3) is determined, and linear wear intensity ln is calculated as the ratio of linear wear h to friction path L.
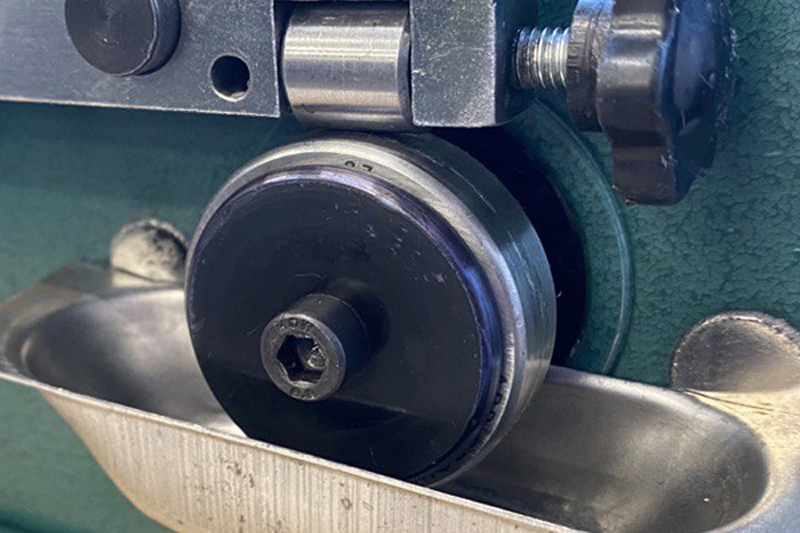
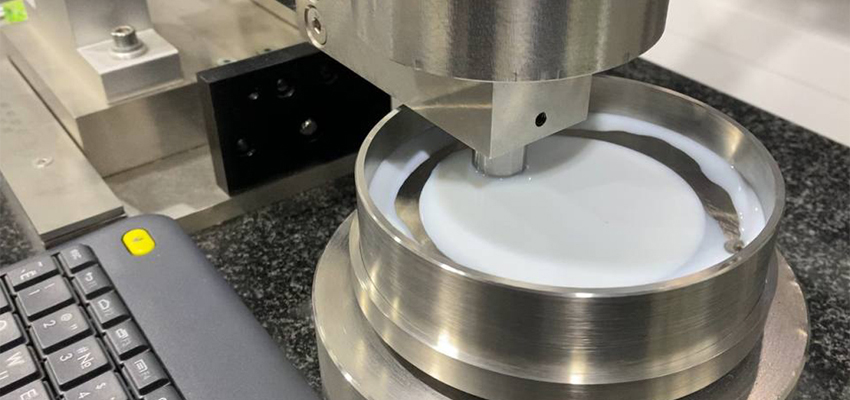
Fig.1. Reichert friction machine
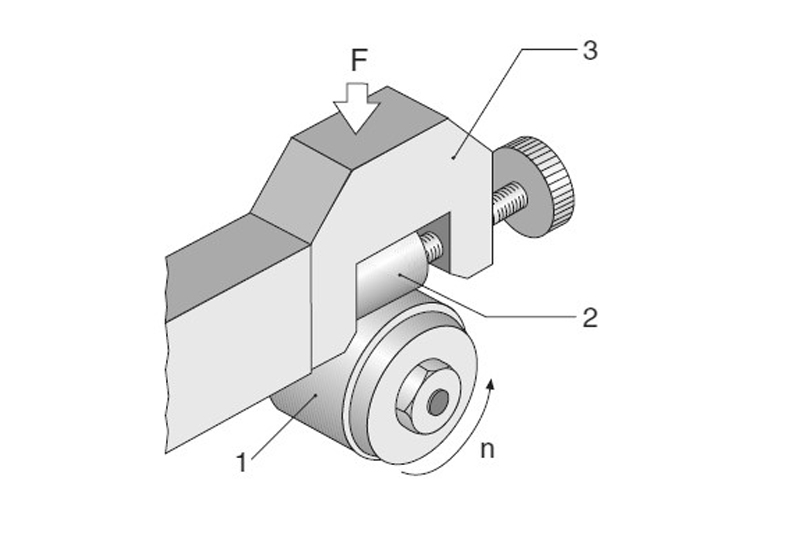
Fig.2. Friction scheme during the tests according to the Reichert Method: 1 – rotary roller; 2 – motionless roller; 3 – loading lever
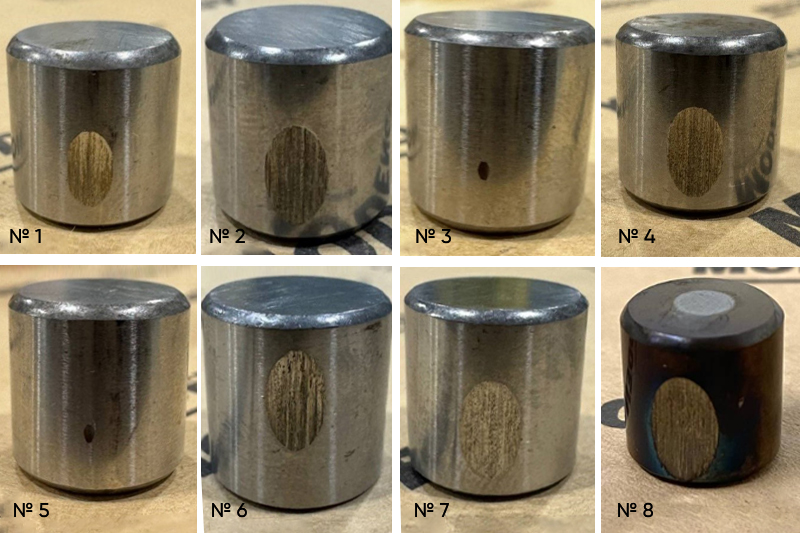
Fig.3. Appearance of the wear spot on the motionless roller: on 7 samples
1.2. This Stage Results
The test results are presented in Table 1.
Table 1
|
Sample Number |
Lubricating Material Name |
Friction Path L, m |
Wear Spot Length l, µm |
Linear Wear h, µm |
Wear Intensity Ih |
|---|---|---|---|---|---|
|
1 |
Lubricoolant No.1 |
402 |
6200 |
242 |
6,02·10-7 |
|
2 |
Lubricoolant No.2 |
402 |
7200 |
327 |
8,13·10-7 |
|
3 |
Lubricoolant No.3 |
402 |
1300 |
11 |
2,74·10-8 |
|
4 |
Lubricoolant No.4 |
402 |
7000 |
309 |
7,69·10-7 |
|
5 |
Lubricoolant No.5 |
402 |
1400 |
12 |
2,99·10-8 |
|
6 |
Lubricoolant No.6 |
402 |
7000 |
309 |
7,69·10-7 |
|
7 |
Lubricoolant No.7 |
402 |
7500 |
354 |
8,81·10-7 |
|
7 |
No lubricoolant |
4021 |
11400 |
639 |
1,59·10-6 |
2. Detecting anti-friction properties according to ASTM G99 Standard
2.1. Methodology and Equipment Description
The tests are held according to ASTM G99 Standard on the ‘sphere-to-disk’ scheme (see Fig.4) at slide friction. The method described in this Standard is used in international practice to identify friction and wear parameters.
Friction pair configuration: Ø6.35 mm diameter spherical indenter according to GOST 3722 - a sample in the form of Ø80 mm diameter and 0.8 mm thick disk.
Spherical indenter material: ШХ15 steel according to GOST 801 Sample material: AISI 430 steel
Lubricating material: lubricoolant No.1 / lubricoolant No.2 / lubricoolant No.3 / lubricoolant No.4 / lubricoolant No.5 / lubricoolant No.6 / lubricoolant No.7 / no lubricating material
Lubricating method: by dipping
Lubricating material volume in the container: 17 ML
Slide velocity: V=0.1 m/s
Load: F=10.2 N
The tests are held on the friction machine (see Fig.5). The friction machine is equipped with NI LabVIEW automated control and data registering system.
The spherical indenter is set into a holder (see Fig.6), and is pressed to the sample in the form of a disk rotating at frequency n=38 rpm with the given force F. In process of testing sliding friction force values are kept registering continuously, and friction coefficient value is calculated automatically, and are being displayed on the screen in the form of graph.
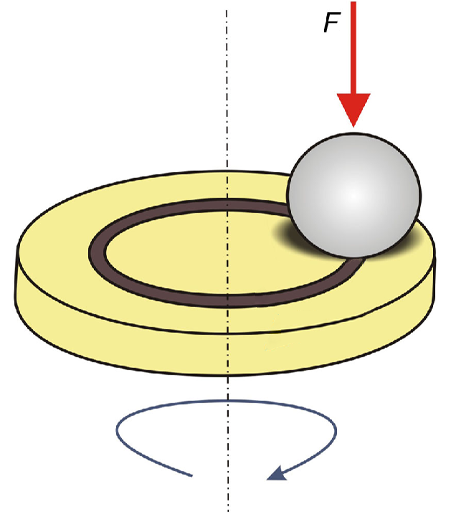
Fig.4. Friction scheme for the tests
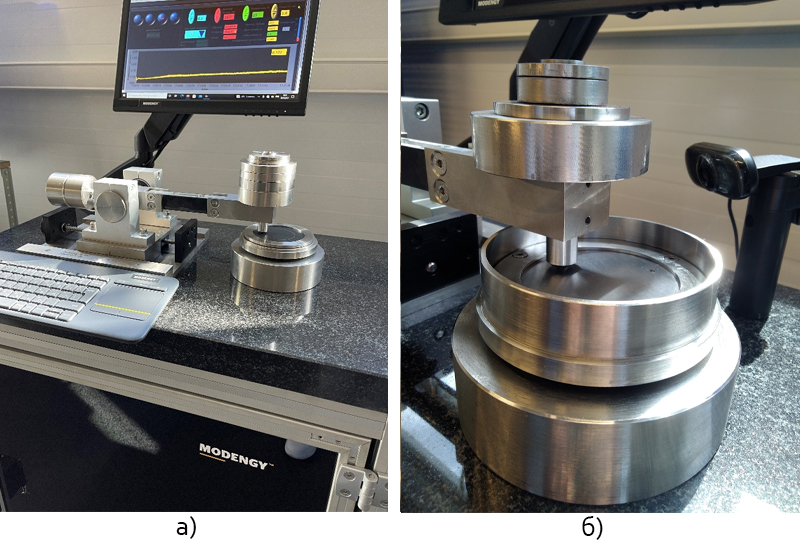
Fig.5. Friction machine (а – general appearance, b – the test unit with the set container for a liquid lubricating material)
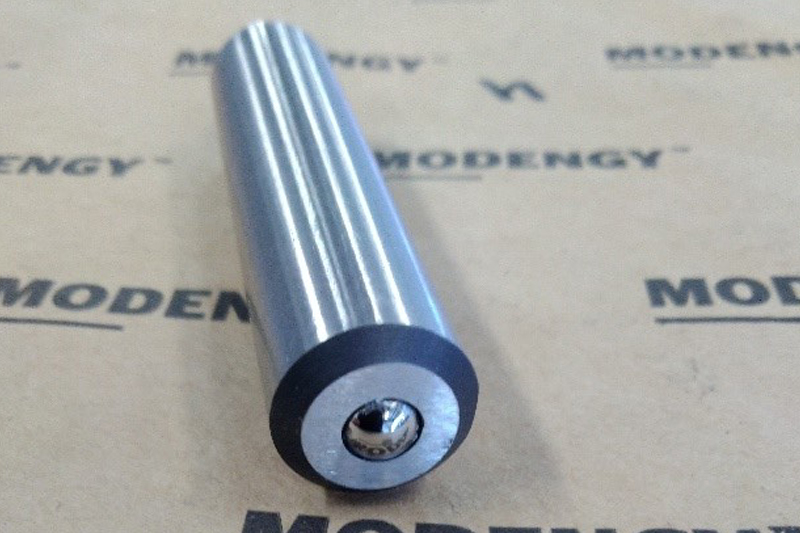
Fig.6. The holder with the spherical indenter set in it.
2.2. This Stage Results
The test results are presented in Table 2.
Table 2
|
Experiment Number |
Lubricating Material Name |
Friction Path L, m |
Coefficient of Static Friction, f0 |
Coefficient of Sliding Friction, fav average |
|---|---|---|---|---|
|
1 |
Lubricoolant No.1 |
30 |
0,104 |
0,119 |
|
2 |
Lubricoolant No.2 |
30 |
0,118 |
0,119 |
|
3 |
Lubricoolant No.3 |
30 |
0,123 |
0,122 |
|
4 |
Lubricoolant No.4 |
30 |
0,047 |
0,079 |
|
5 |
Lubricoolant No.5 |
30 |
0,082 |
0,076 |
|
6 |
Lubricoolant No.6 |
30 |
0,093 |
0,093 |
|
7 |
Lubricoolant No.7 |
30 |
0,079 |
0,075 |
|
8 |
No lubricoolant |
30 |
0,950 |
0,667 |
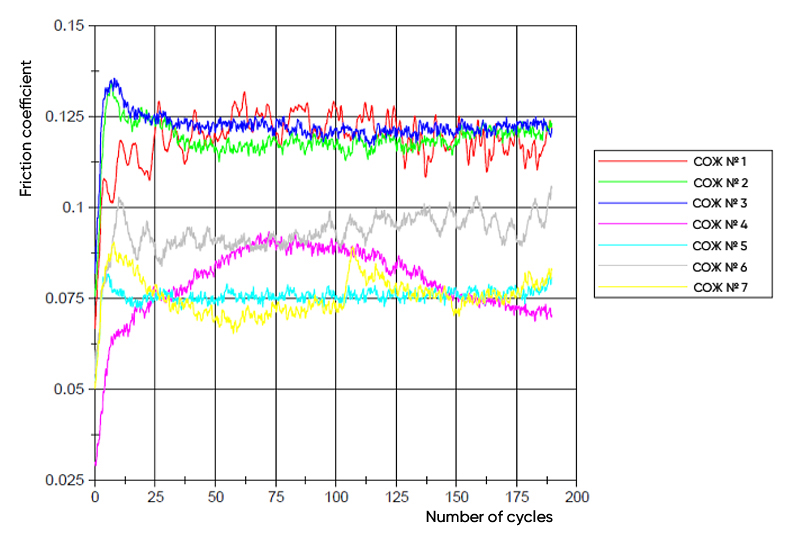
General graph of friction coefficients changing in process of the tests is presented in Appendix 1.
3. Conclusions
3.1. Conclusions about lubricoolant tests according to the Reichert Method
3.1.1. Based on the test results according to the Reichert Method, use of a lubricoolant enables to reduce wear intensity from by 1.8 times (Sample No.7) up to by 58 times (Samples No.3 / No.5).
3.1.2. The increase line in terms of wear intensity from left to right among the tested samples looks like this: [ No.3 → No.5 → No.1 → No.4 / No.6 → No.2 → No.7 ] → No.8.
3.1.3. Sample No.8 that was tested without any lubricoolant has gained temper colors (see Fig.3) what which indicates to significantly higher friction heating temperature. No such effects were detected on the samples that were tested using a lubricoolant.
3.2. Conclusions about lubricoolant tests according to ASTM G99 Standard
3.2.1. Based on the test results according to ASTM G99 Standard, use of a lubricoolant enables to reduce coefficient of static friction f0 from by 7.7 times (Sample No.3) up to by 20.2 times (Sample No.4).
3.2.2. Based on the test results, use of a lubricoolant enables to reduce average friction coefficient fav from by 5.5 times (Sample No.3) up to by 8.9 times (Sample No.7).
3.2.3. The increase line in terms of average friction coefficient fav from left to right among the tested samples looks like this: [No.7 → No.5 → No. 4 → No.6 → No.1 / No.2 → No.3] → No.8.
3.3. General Conclusions
3.3.1. Use of the samples of all these lubricoolants contributes to friction process stabilizing as this decreases spread of friction coefficient values, and eliminates stick-slip motion.
3.3.2. Sample No.5, according to the test results of the Reichert Method, and according to the test results on ASTM G99 Standard, has optimal linear wear and average friction coefficient values.
3.3.3. Sample No.3 has minimal wear (according to the Reichert Method), although, at the same time, average friction coefficient of this Sample has the highest value among all tested Samples. So, this factor can be used by a manufacturer at solving certain specific tasks.
3.3.4. Sample No.2 has ones of the highest wear and average friction coefficient values due to integrated assessment of the test results according to the Reichert Method, and to ASTM G99 Standard.
Appendix 1
General graph of friction coefficient changing during performing the works at Stage 2.
If holding of the tribotechnical tests is relevant for you, address to the Modengy company, please.
Request information